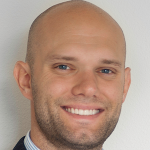
G. Elliott Morris is a data journalist and United States correspondent for The Economist. He covers political events, data on candidates running for office, polls on public attitudes, and makes election forecasting models.
Below, Elliott shares 5 key insights from his new book, Strength in Numbers: How Polls Work and Why We Need Them. Listen to the audio version—read by Elliott himself—in the Next Big Idea App.
1. Polls are products of both science and art.
If you have heard anything about political polls, it is probably about their failures. In 2016, polls pegged Hillary Clinton’s vote share as higher than Donald Trump’s in five states that she ended up losing: Wisconsin, Michigan, Pennsylvania, North Carolina, and Florida. These errors caused predictions to misfire. Popular models stipulated Clinton had a 70 – 99 percent chance of winning, but she lost.
Errors were repeated in 2020. Polls said Joe Biden would win the national popular vote by 8 points, but ended up only winning by only 4. Polls similarly overestimated his support in close states, like Wisconsin, Michigan, Pennsylvania, and Arizona.
So maybe the polls are broken. If they say one candidate is ahead and she loses, then they have certainly got something wrong. But actually, the error is thinking that polls pick winners and losers. They estimate about some underlying quantity in the population.
Technically, polls are the science of sampling people from a broader population. But I prefer thinking about it as analogous to how chefs taste soup. Imagine you have cooked a pot of tomato soup. How do you know if it’s done? Have the herbs mixed? To know, dip a spoon in. Take a sample of the whole pot to judge the rest. The spoonful is a pretty good representation of the whole soup.
However, the population of Americans is not like tomato soup, but like a minestrone: chunks of pasta, tomato, onion, and beans, which all need to be sampled in a single spoonful to judge the quality of the soup. Similarly, a poll must reach a broad set of Americans: white, people of color, rich, poor, college-educated, etc. When they don’t, they misfire.
“The error is thinking that polls pick winners and losers.”
Pollsters and reporters know that polls can be wrong. That’s why surveys come with a margin of error. The margin of error is the calculation as to how far off they might be from the truth, based on the proportion of American demographics in their sample—in other words, maybe they got too many pieces of pasta and not enough beans.
2. Always double the margin of error.
The larger the poll, the better it reflects the opinions of all Americans. When pollsters talk to 1,000 Americans and find that 50% of them like diet cola over classic cola, they’ll say something like “our poll also comes with a 3% margin of error.” That means the true proportion who like diet coke could be 47-53%.
But the margin for error only covers sampling error. There are other types of error, too. Pollsters can ask a question in such a way that it influences a particular response, or word it so that people misunderstand what the pollster is asking—this type is measurement error. Or if they fail to define the population they are trying to sample, then this is a coverage error. Plus, there’s something called nonresponse. This happens when a particular group is systematically less likely to take your poll than another group. That’s what happened in 2016 and 2020, when Republicans were less likely than Democrats to take polls.
Researchers at Microsoft and Harvard have found that sources of error can even bias multiple polls in the same direction. Therefore, when you read a margin of error, double it.
3. Polls are much better than they used to be.
After the 2016 election, the professional society for pollsters called for an inquiry into their estimates. What exactly had gone wrong? Was the whole industry doomed?
As part of their report, the American Association for Public Opinion Research (AAPOR) dug up all the polls that had ever been conducted for a presidential election. This dated back to 1936, when George Gallup published the first public scientific poll of an election. AAPOR tracked whether polls had improved since Gallup’s.
“Pollsters struggle to meet extremely high expectations, and yet they still provide relatively accurate readings of public opinion.”
AAPOR reported that national polls in 2016 overestimated Hillary Clinton’s margin of victory by about 2 percentage points, giving her a 3 – 4 point margin on average, instead of the 2.1 she ended up getting. Historically, that was an above-average performance. Polls were off by about 3 points on average, going back to 1936. Moreover, polls conducted further in the past were far worse. Gallup’s first poll estimated that Franklin Roosevelt would beat his challenger by 12 points. He won by 24, making Gallup wrong by 12 points.
Polls are an uncertain, constantly evolving, imperfect science. Pollsters struggle to meet extremely high expectations, and yet they still provide relatively accurate readings of public opinion. One lesson from recent misfires may be to lower our expectations. In the grand scheme of things, in the full range of values from zero to 100, being able to predict an election with an error of 2 points is pretty good.
4. Pollsters don’t just ask about elections.
Pollsters also ask about broader political issues, which result in issue polls. These get used by leaders to shape campaign decisions and government policy.
Before George Gallup, there was a man named Emil Hurja. He was employed by Franklin Roosevelt for the express purpose of gathering polls and figuring out how popular the president was in certain areas of the country. This let the Democratic Party know which states were on the fence between one political party and the other. Hurja and Franklin could respond by scheduling visits to try swaying communities to their side. The data boosted their odds of future victories.
Emil Hurja became known for his exceptional ability to predict elections. He did this by taking data from pollsters, like George Gallup, Elmo Roper, and the Literary Digest (a magazine that conducted less scientific polls, called straw polls), and correcting them for previous biases. If a poll had overestimated Republicans in the past election, Hurja would give Democrats a corresponding boost. He would also ask pollsters for raw data on how the supporters of previous candidates were going to vote this time. This improved the quality of predictions. In 1932, Hurja predicted Roosevelt would win by 7.5 million votes. He won by 7.1 million.
This earned Hurja the nickname “the wizard of Washington,” and a special seat next to the president. He was in charge of doling out government jobs, which he gave only to the president’s most stalwart supporters, or to people from competitive elections. And when key New Deal programs were ruled unconstitutional, causing Roosevelt to go on angry public tirades against politicians and big business, Hurja advised him to cool his rhetoric—which was sinking his approval ratings—and find solutions instead. According to one historian, Roosevelt soon refocused and passed new versions of the affected laws. Polls helped save the day.
“Polls might be thought of as a mirror, reflecting the image of the body politic back to those who gaze into the reflective glass.”
Politicians and presidents alike have used polls ever since to tailor messages and push popular policies. Richard Nixon did it with the Clean Air Act, Bill Clinton with universal child health care, Donald Trump for criminal justice reform, and Joe Biden for fiscal stimulus during the coronavirus pandemic. Though the public is not perfectly informed on every issue, in a democracy, they have a role in steering the ship of state. Thus, politicians will listen to the polls.
5. Polls are a tool for democracy.
In his writing, George Gallup emphasized the work of political philosopher and British-American statesman James Bryce. Bryce said that public opinion was the “real ruler of America,” and that “if the will of the majority of citizens were to become ascertainable at all times,” then America could enter a “fourth stage” of its democracy—where the public opinion not only informed the government, but ruled; where it “not only reigned, but governed.”
Gallup, Hurja, and other acolytes for the polls may have been a bit optimistic with what their tools could provide, but they were nevertheless on to something profound. Gallup promised that polls could measure “the pulse of democracy”—that’s what he titled his most famous book on public opinion, published in 1948.
With nearly 100 years of surveys under their belt, pollsters now know that they will never be able to provide the accuracy that such a precise medical metaphor suggests. Polls might instead be thought of as a mirror, reflecting the image of the body politic back to those who gaze into the reflective glass. In a country that promises a government of, by, and for the people, polls are not just a novelty for elections, but an empowering addition to the democratic experiment.
If we stop expecting the highest degree of accuracy from the polls before competitive elections, and take the time to understand how they work, where they come from, and the philosophical roots of public opinion in a democracy, then we can unlock the potential of these data.
To listen to the audio version read by author G. Elliott Morris, download the Next Big Idea App today:
